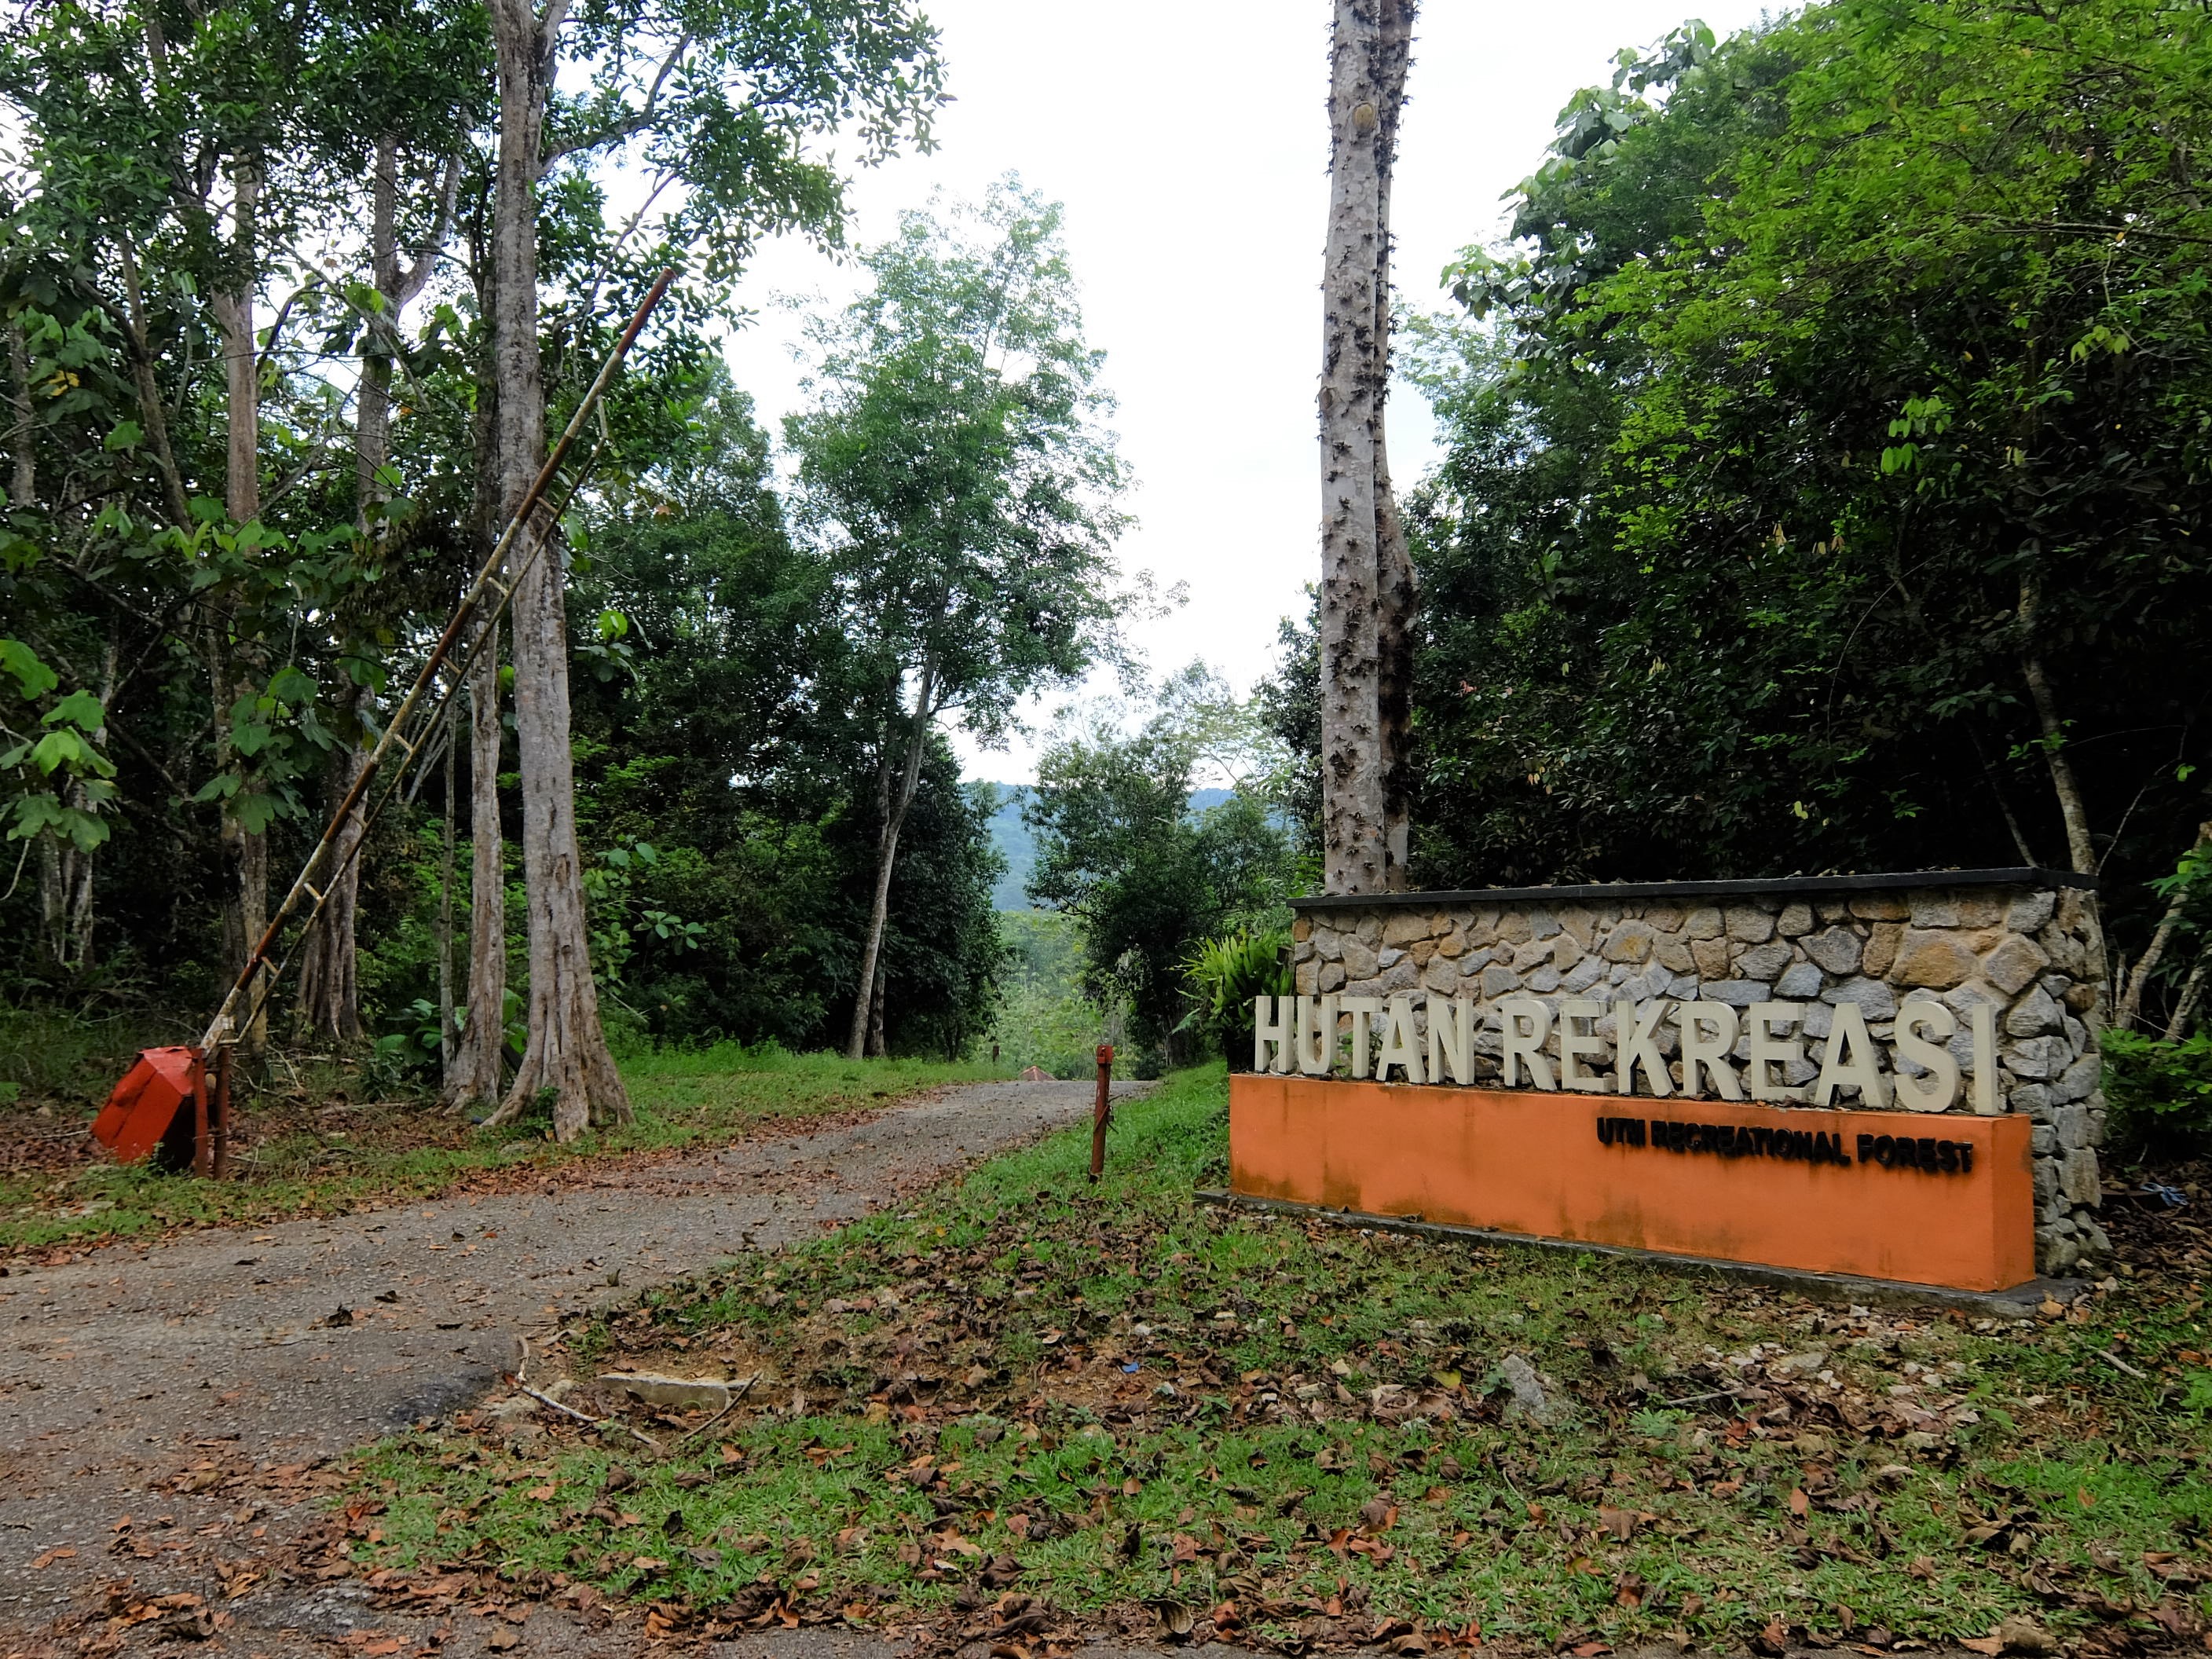
Estimation Above Ground Biomass in UTM Recreational Forest
Innovative methods for estimating and monitoring forest biomass to support sustainable forest management and carbon sequestration initiatives.
Innovative methods for estimating and monitoring forest biomass to support sustainable forest management and carbon sequestration initiatives.
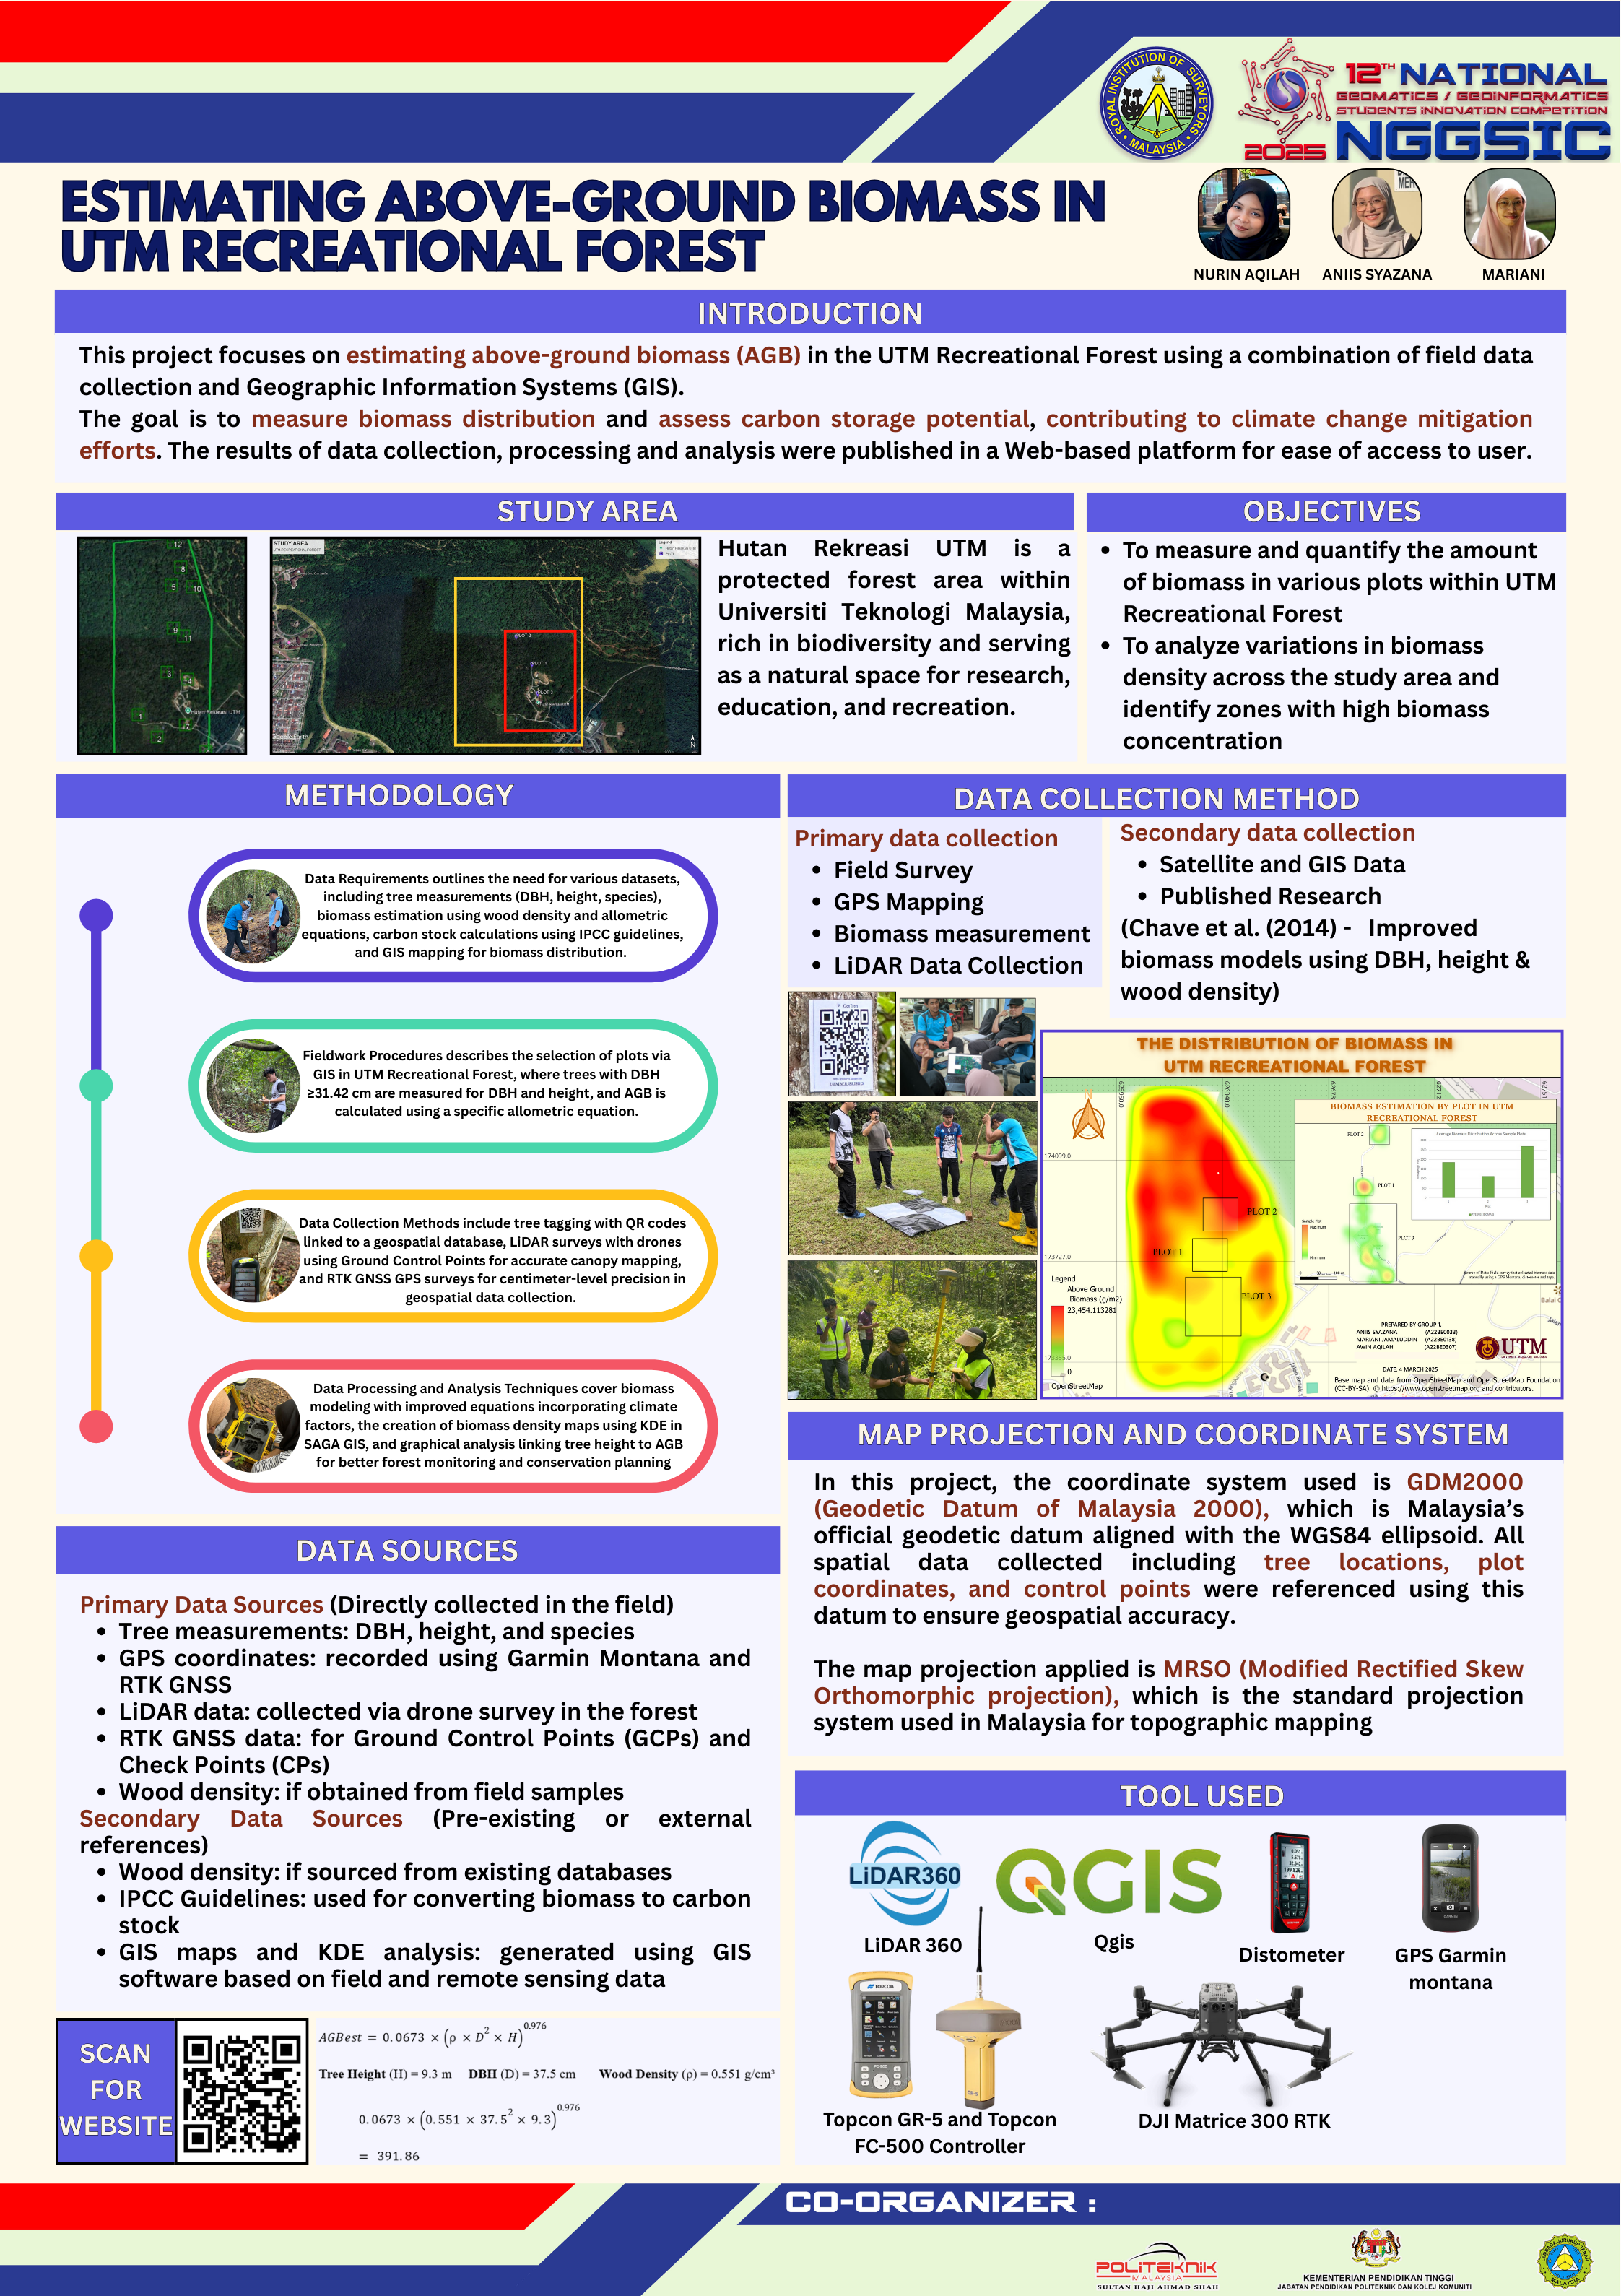
Focus on methods to measure and estimate the above-ground biomass of trees using field data and GIS.
To Identify the amount of biomass in different plots at UTM Recreational Forest.
To analyze variations in biomass density and identify high-biomass zones within the study area.
To provide insights into the role of above-ground biomass in carbon sequestration and climate change mitigation efforts.
Our project aims to develop improved methods for estimating above-ground biomass in forest ecosystems using a combination of field measurements, remote sensing data, and advanced computational models. The accurate estimation of forest biomass is crucial for:
Innovative approaches to biomass estimation
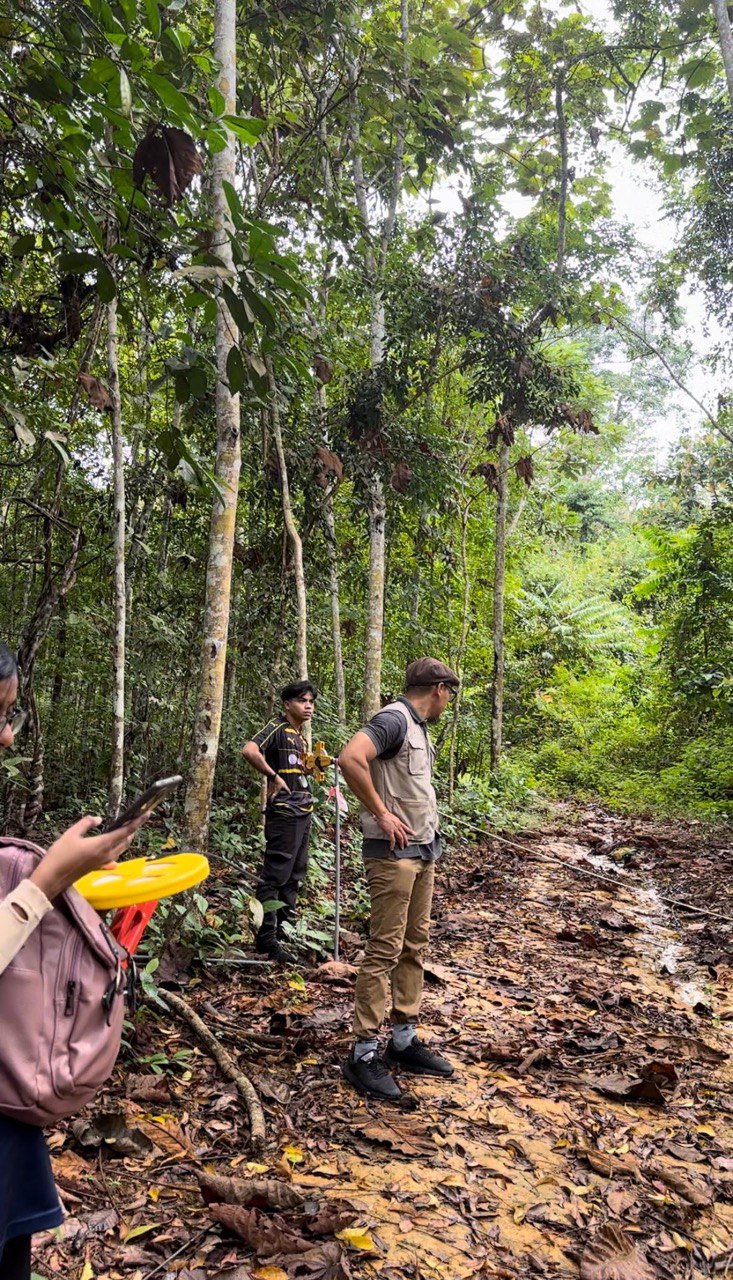
Our field sampling protocol involves systematic collection of tree measurements including:
These measurements are used to develop allometric equations for biomass estimation.
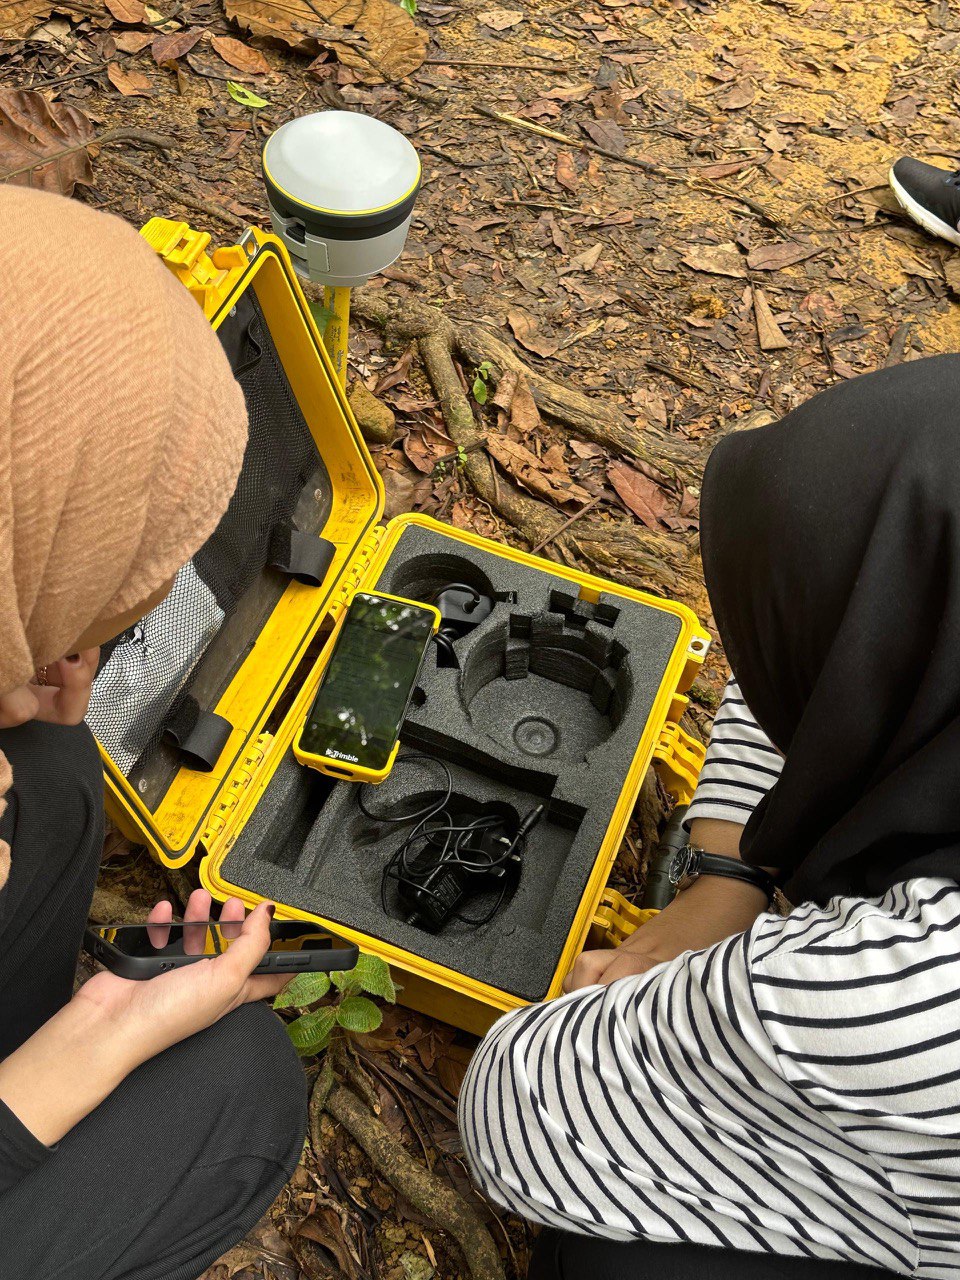
We employ multiple remote sensing technologies to enhance our biomass estimation:
Integration of these data sources allows for large-scale biomass mapping.

The data processing workflow for estimating above-ground biomass in UTM Recreational Forest involves multiple steps to ensure accuracy and reliability:
This integrated approach enables robust biomass estimations across diverse forest types.
Key findings from our biomass estimation research
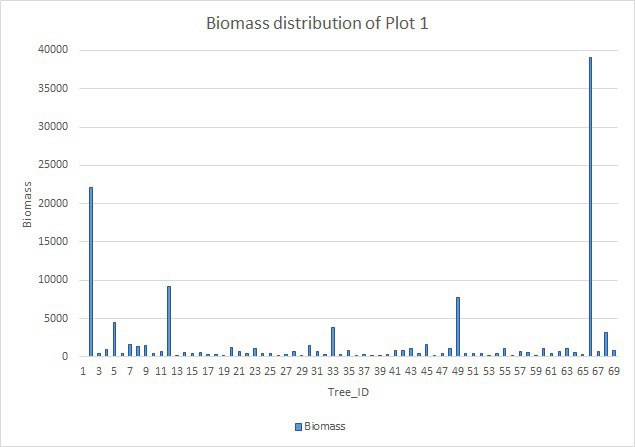
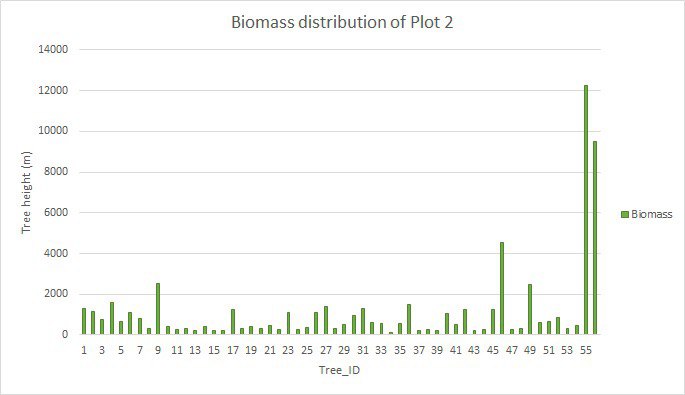
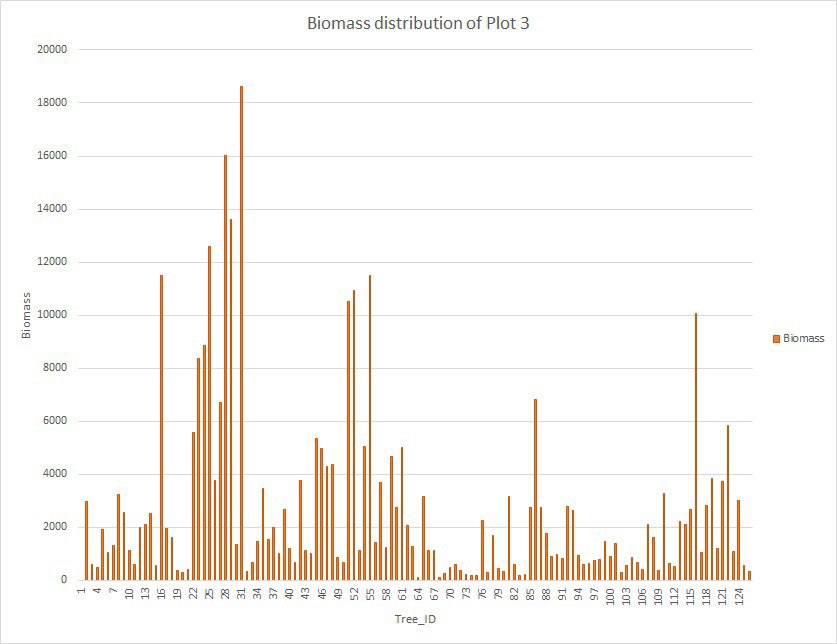
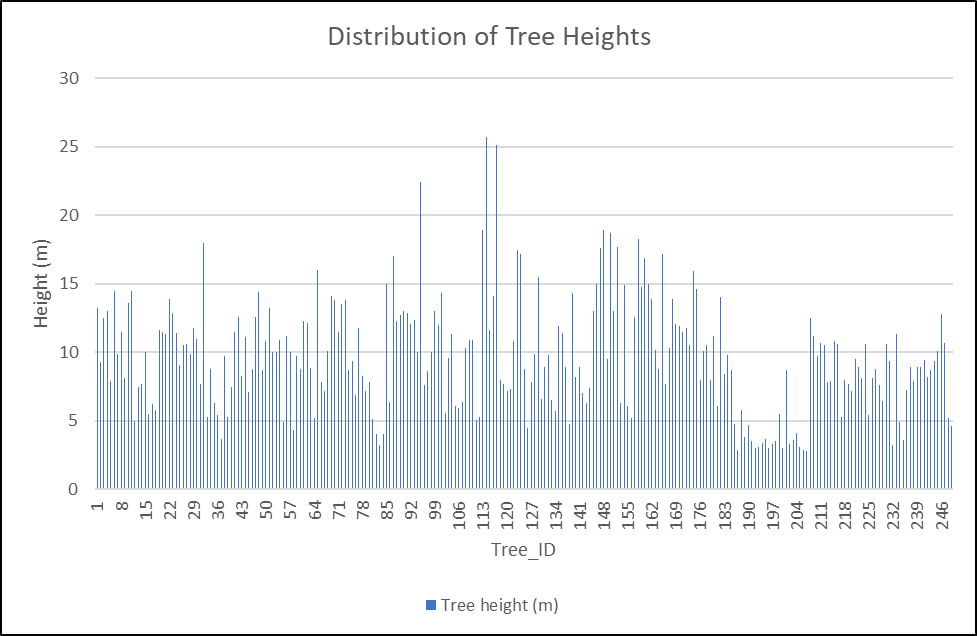
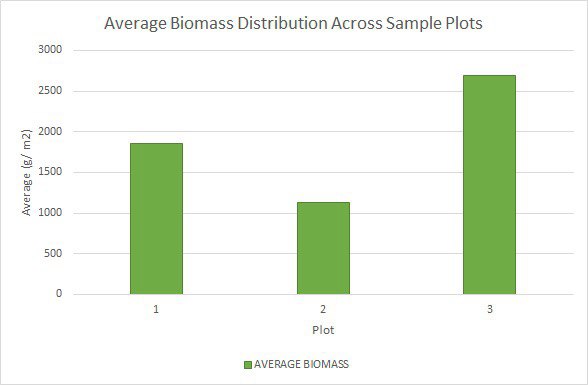
The three graphs have different biomass distributions. Plot 2 shows more uniformly distributed tree biomass with only modest swings and no outliers that are Plot 1 has a highly skewed distribution with one extreme outlier that dominates the sample and a few trees with greater biomass values. This suggests a few giant trees among numerous smaller ones. Plot 3 has a broader biomass variance, with multiple peaks representing plants with much higher biomass values. This suggests a wider plot tree size range. The data shows that Plot 2 has the most uniform biomass distribution, Plot 1 has extreme outliers, and Plot 3 has moderate variation with many peaks.
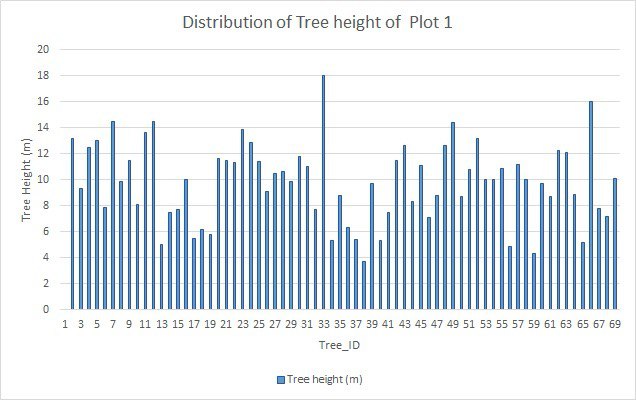
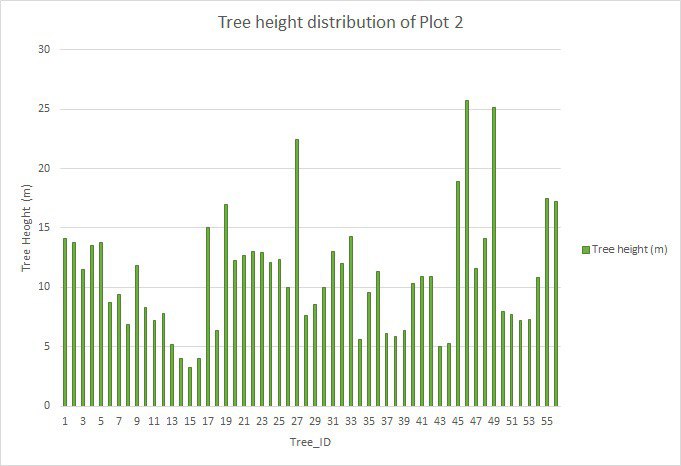
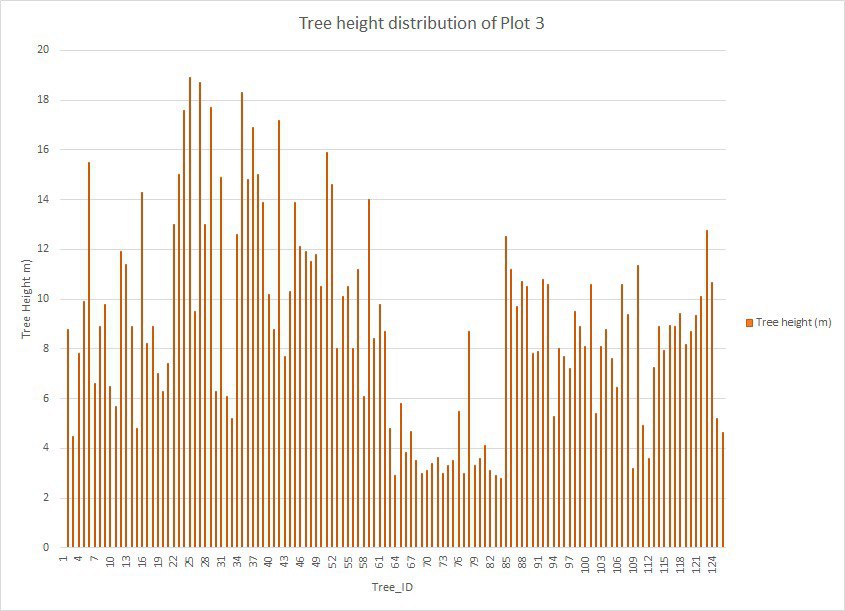
The tree height distribution varies across the three plots. Plot 3 shows a wide range of tree heights, with many trees reaching significant heights, especially in the lower Tree_ID range, while others remain relatively short, indicating a mix of mature and young trees. Plot 2 has a relatively uniform distribution of tree heights, though some trees stand out with significantly greater heights, suggesting the presence of a few dominant trees among a generally balanced population. Plot 1 exhibits moderate variation, with tree heights distributed somewhat evenly, but a few taller trees create noticeable peaks. Overall, Plot 3 has the most height variation, Plot 2 features a few extreme values, and Plot 1 maintains a relatively balanced height distribution.
| Species Name | Tree Height (m) | DBH (CM) | Biomass |
|---|---|---|---|
| Anthocleista grandiflora Gilg | 13.2 | 244.2 | 22095.74289 |
| Aquilaria Malaccensis | 12.9 | 70.4 | 1085.022717 |
| Boreal Forest | 120-180 | 60-90 | 90-95 |
| Mangrove Forest | 250-350 | 125-175 | 82-89 |
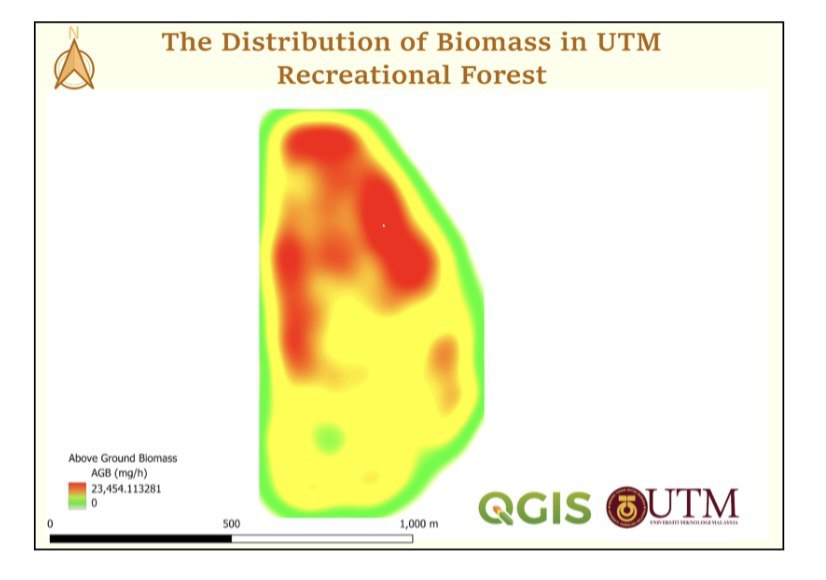
Spatial distribution of above-ground biomass across study regions
Maps and graph bar for visual representations of our biomass research
.jpg)
Meet the team member behind this project
Web Developer
aniissyazana@graduate.utm.my
GIS Specialist
mariani02@graduate.utm.my
GIS Analyst
aqilah-03@graduate.utm.my
Calculate the above-ground biomass of trees using diameter at breast height (DBH), tree height, and wood density measurements.
This estimation is based on general allometric equations and may vary depending on species and local conditions.
This calculator uses a general allometric equation for estimating above-ground biomass. The equation considers the diameter at breast height (DBH), tree height, and wood density to provide an estimate of the tree's biomass.
The formula used is a simplified version of the Chave et al. (2014) equation:
AGB = 0.0673 × (ρ × D² × H)^0.976
Where:
AGB = Above Ground Biomass (kg)
ρ = Wood density (g/cm³)
D = Diameter at breast height (cm)
H = Tree height (m)